

Reports
Documents that nodes build from their results — conclusion first, evidence underneath.
Many nodes don’t just write a dataset or a model: they explain what they found. Training nodes report how the run converged, evaluation nodes report where a model fails, data quality nodes report what’s wrong with a dataset. These reports are documents built from the run’s own results, with charts, tables, metrics and image galleries you can drill into.
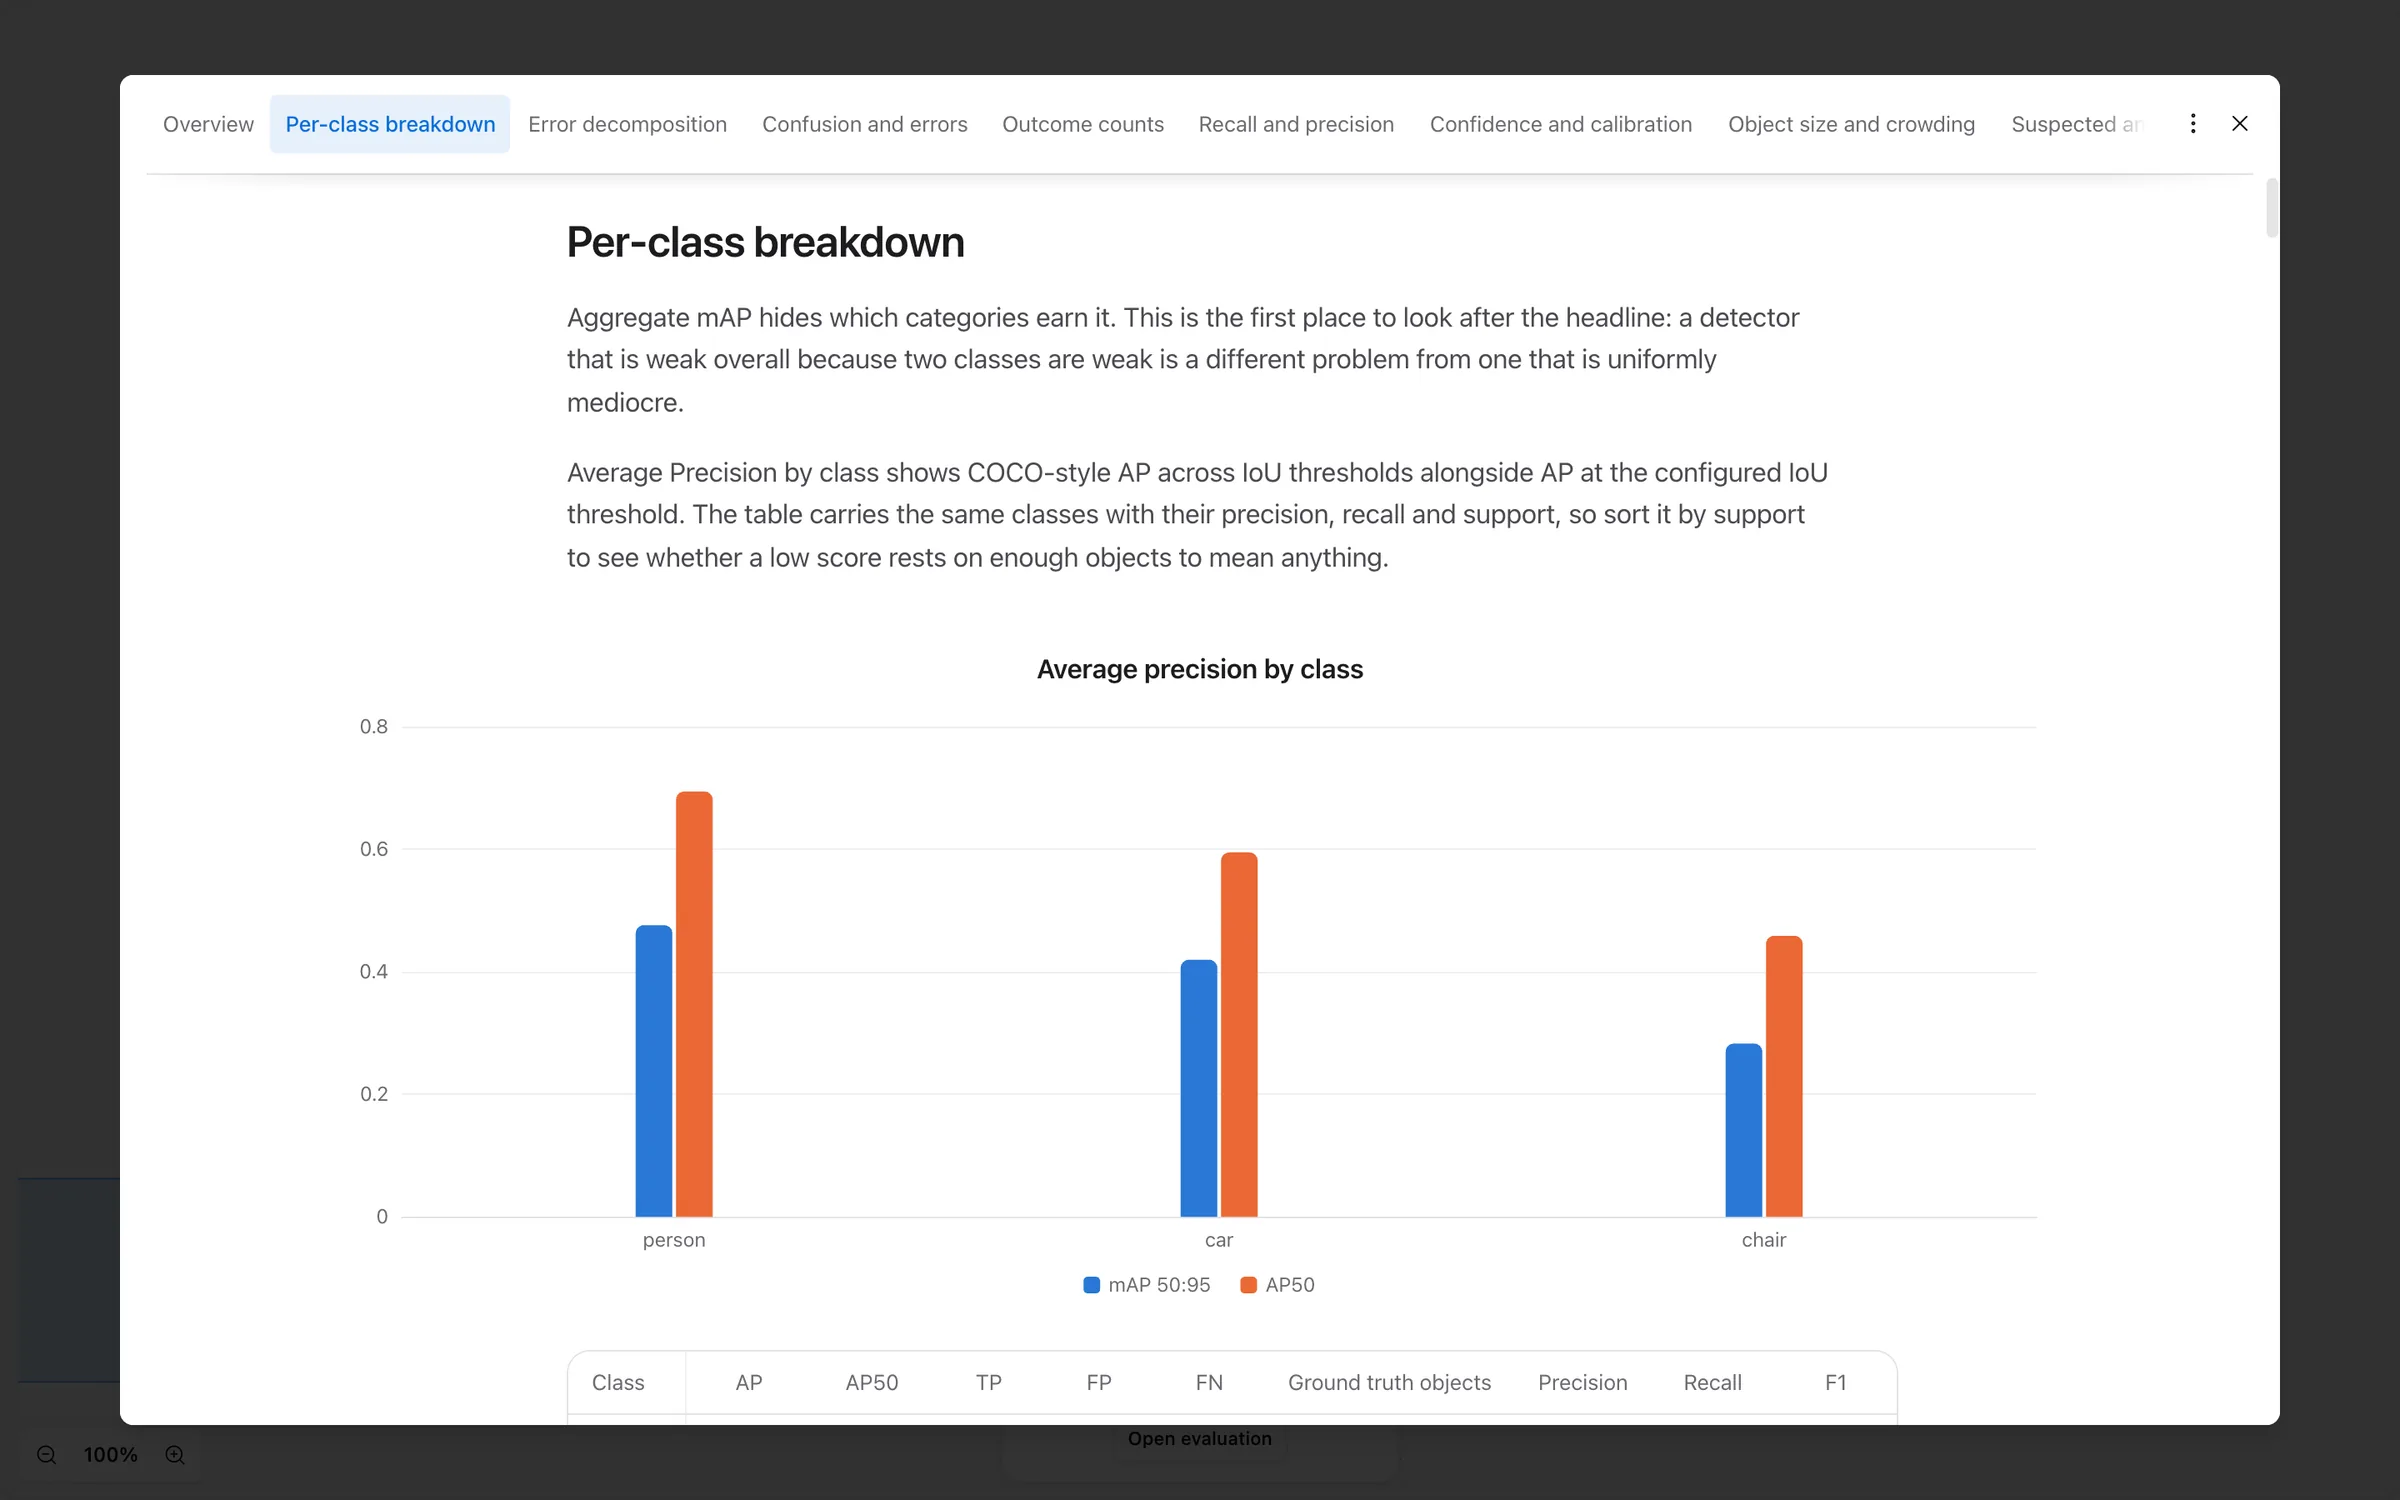
What a report is like
A report is written for someone deciding what to do next, so it states its conclusion first — the model is ready for review, three classes are under-represented — and puts the supporting evidence below. Charts, tables and findings lead to the images behind them, so you can check a number against the data instead of taking it on faith.
Reports from long runs, such as training, are live: open one while the node is still running and it refreshes as new epochs come in.
Where to open them
- Open report on the node that produced it — the most common way.
- The Artifacts of a run in the node’s History tab, for reports of earlier runs.
- Report on a model or model version in the registry, for its training report, and next to each evaluation.
- Open in a Benchmarks leaderboard.
- Report on a deployment.
Keeping and sharing
Each run builds a new report and keeps the earlier ones, so you can compare this week’s evaluation with last week’s. A report is an asset of the workspace: anyone who can see the flow or its data can open it.
To send a report to someone outside OvalBee, use Report actions → Export as .html for a self-contained file, or Print… to save it as PDF.
Related pages
- Models and deployments — where training and evaluation reports are linked.
- Check and clean a dataset — reports on data quality.
- Evaluate and compare models — reports on model quality.